Analog pH Sensor with Arduino Uno
Last updated June 2020
Introduction
Welcome to ProteShea – in this project, we’re going to show you how to interface a pH sensor with the Arduino Uno (rev 3). The purpose of the pH sensor is to determine if a solution is neutral, acidic, or alkaline. This sensor can be used to gauge water quality with a whole suite of sensors including ORP (oxidation/reduction potential), DO (dissolved oxygen), etc. The basics of how the pH sensor works (minus the details involved for describing the chemistry taking place) and how to create a circuit model of the sensor will be discussed.
Let’s find out if your water is healthy!
Disclaimer
ProteShea, LLC is a participant in the Amazon Services LLC Associates Program, an affiliate advertising program designed to provide a means for sites to earn advertising fees by advertising and linking to Amazon.com
Some links may be affiliate links, in which ProteShea, LLC earns a commission if you use that affiliate link. Please note that this is at no additional cost to you and helps us in creating more content.
Here’s what you’ll need to get started:
- FuelCan
- Captis Canister
- Jackery Armor battery
- USB to 5-pin DIN cable kit
- Modulus Canister (optional)
- Modulus Kit (optional)
- Solderless breadboard (optional)
- Arduino Uno Rev3
- DFRobot pH sensor
- pH Storage Solution
- pH Calibration Solution
- 16×2 Character LCD
- 12″ F/M jumpers
- 12″ M/M jumpers
- 30 AWG wire
- 30 AWG wire wrap tool
- Soldering iron
- Solder
16x2 Character LCD
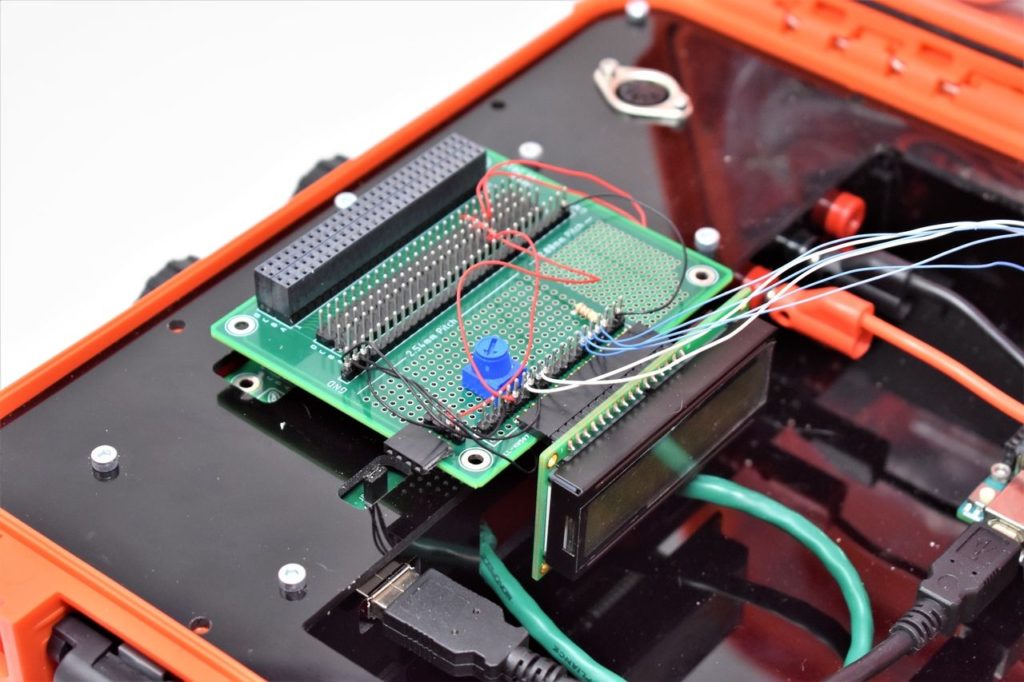
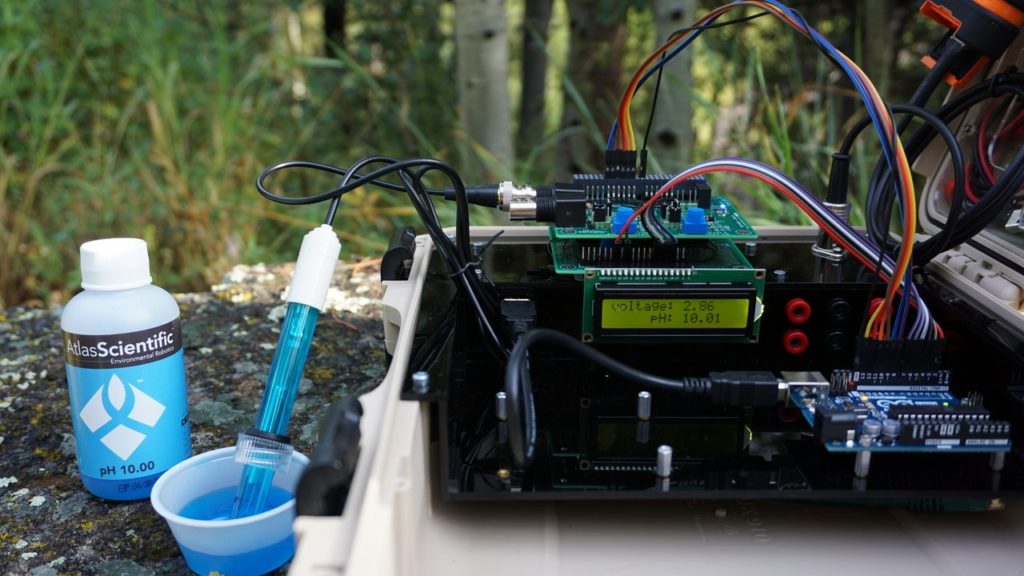
Please see Project 9 on how to interface the 16×2 LCD in 4-bit mode. You should have pins 4, 6, and 11-14 of the LCD connected to Uno pins 2, 3, and 4-7, respectively. The LCD is mounted to the Modulus Canister via the 16-pin, right-angle female header soldered to the 1-to-1 link, as shown in Fig. 1 below. The LCD will be used to display the voltage and corresponding pH value.
Twin Insight: you must use wire wrap to connect the pins from Modulus to the Uno. This allows you to insert Captis on top of Modulus to create the Canister stack.
DFRobot pH Sensor
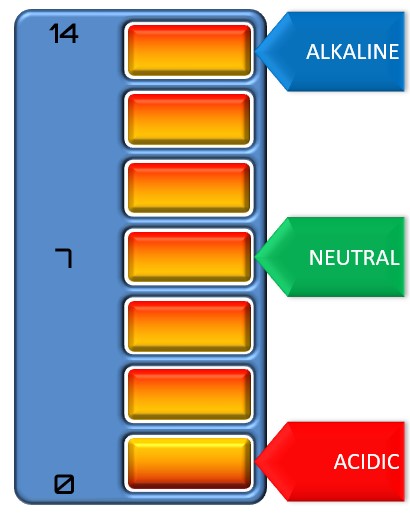
pH (ranges from 0 to 14) is a logarithmic measure of hydrogen ion (H+) concentration (range is from 1 and 10^-14 moles per liter) in a solution1. For example, a solution of 10^-9 H+ would equate to a pH of 9. Furthermore, a pH of 7 is considered neutral, a pH of < 7 is acidic, and a pH of > 7 is alkaline, as shown in Fig. 2.
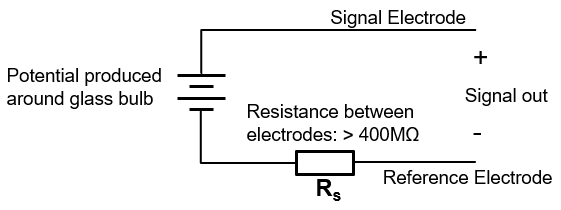
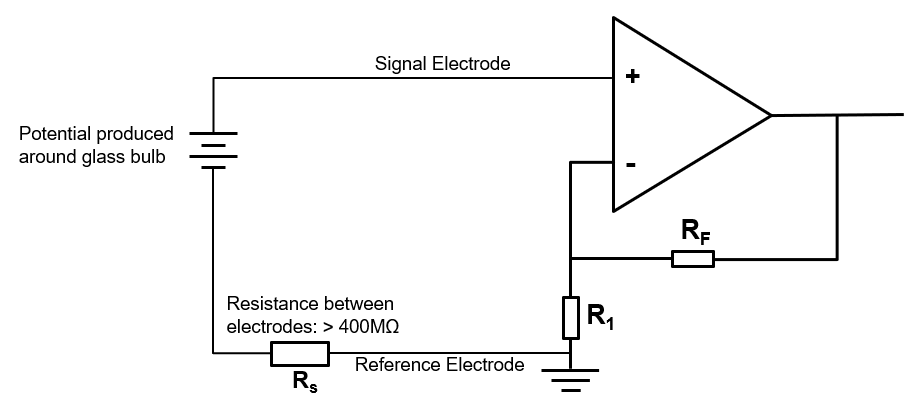
The pH sensor contains two electrodes to generate a voltage, which is shown in Fig. 3, with the positive and negative terminals being the signal and reference electrodes, respectively. Since we need the reference electrode to be at 0 volts, we use the power/ground isolation feature of Captis so our ground doesn’t pick up noise from other sensors or canisters that are included in a canister stack.
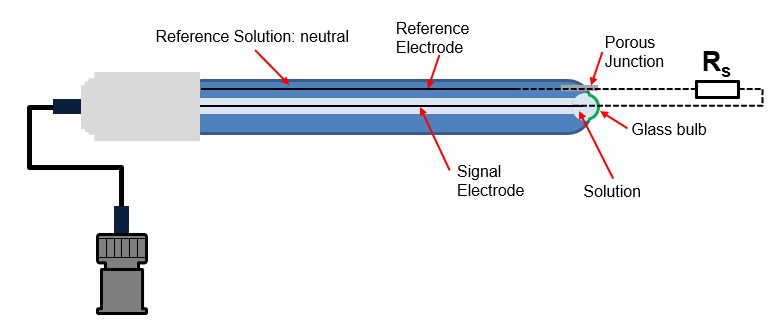
When the sensor is immersed in a liquid you’re trying to measure, a voltage potential is built up around the glass bulb shown in Fig. 4. The material of the glass bulb allows an ion exchange to occur with the hydrogen ions in the measured solution. To have a complete circuit, a high-impedance path is created between the two electrodes, denoted as “Rs” in the image below. Knowing that the two electrodes generate an output voltage and we have a series resistance Rs, we can now create a circuit model of the pH sensor. This is shown in Fig. 3.
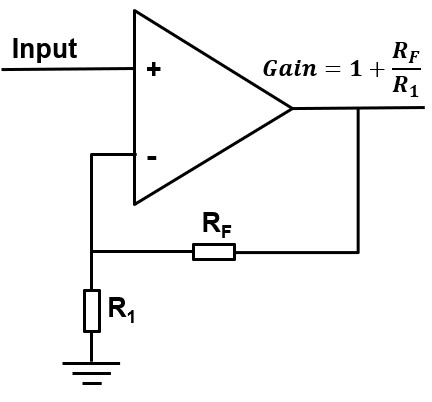
Since we’ve shown that the pH sensor has a very high-impedance and produces a very small output voltage, we’ll need a circuit with a high input impedance so that we don’t distort the significantly small voltage output of the sensor. We can use the high-impedance properties of a non-inverting operational amplifier (op-amp) so we don’t load down the sensor. The non-inverting op-amp configuration is shown in Fig. 5.
Twin Insight: in this case, a digital multimeter can’t be used to measure the output voltage since it has a very low input impedance.
The backside of Captis conveniently contains a graphic of a non-inverting op-amp for quick reference! Essentially, the potential difference is being measured between the glass membrane and the reference electrode. We can further develop our circuit, as shown in Fig. 6.
Next, we’ll need to communicate with Captis via SPI (serial peripheral interface) to read the voltage measurements from the pH sensor. The 8-bit ADC does not require any specific registers to be read from like we saw in Project 19. We simply initiate a SPI transfer by generating clock pulses on SCLK, and data is received on MISO. According to page 18 of the ADC datasheet found here, we’ll need to initiate two SPI transfers to receive all 16 bits of data.
Analog Design
Most analog signals are centered around 0V meaning that they have positive and negative voltages. These analog signals can be very small in amplitude, and measurement can be a challenge with a low-resolution ADC. However, lower resolution usually means lower component cost.
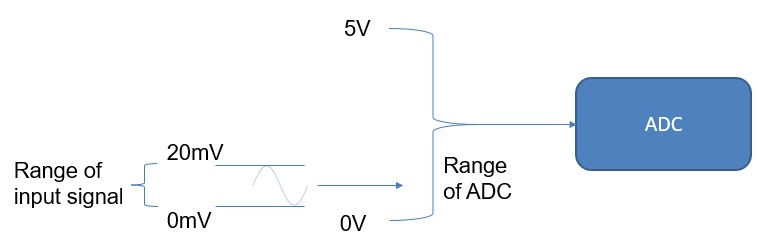
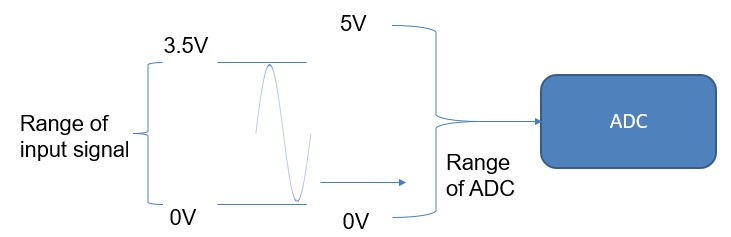
In order for the ADC to sample the voltage from the pH sensor, the voltage range of the sensor needs to be within the operating range of the ADC (i.e. 0V to 5V). By characterizing the pH sensor to obtain its maximum (corresponds to pH of 14) and minimum (corresponds to pH of 0) voltage measurements, a circuit can then be designed to fit those data points within the ADC range.
[Stage 1] The front-end analog circuitry on Captis contains a non-inverting, high-precision operational amplifier (op-amp) with low noise to capture the small signal generated by the pH sensor. [Stage 2] This is followed by an inverting, high-bandwidth op-amp to drive the analog-to-digital converter (ADC). An inverting op-amp works perfectly for offsetting the analog signal so that the entire waveform is shifted above 0V. Why didn’t we choose two high-precision op-amps for Stage 1 and 2? One of the reasons is that high-bandwidth op-amps are usually cheaper than high-precision op-amps.
Captis can easily be configured to match the gain characteristics designed in DFrobot’s schematic which can be found here. The op-amp portion of Captis was simulated (contact us to request the project file) in LTspice and is shown in Fig. 7.
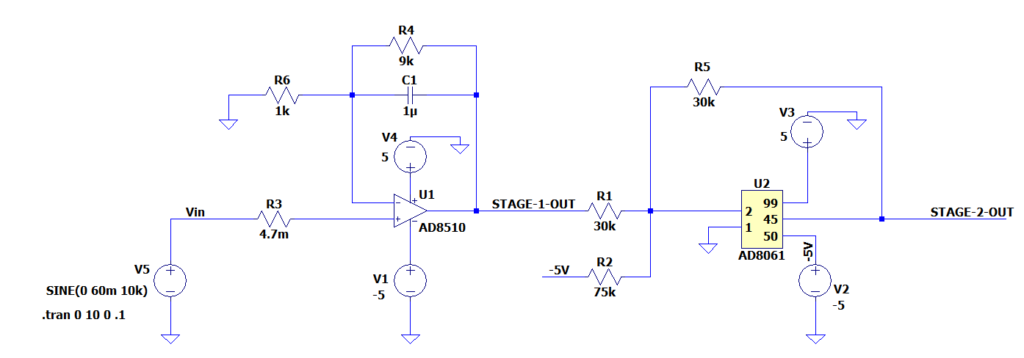
Twin Insight: when using an 8-bit ADC with a 5V supply, we can achieve a resolution of (2^8)/(5V) = 51.2 mV. The signal in the figure below could be sampled as a DC signal instead of an AC signal. If we’re able to amplify the 20mV signal to around 3.5V peak-to-peak, we may be able to recover the waveform depending on the sampling frequency. Lower-level details will be covered in a future topic.
Captis
One of the benefits of Captis is that it can be used to seamlessly interface to a Raspberry Pi since it does not have an on-board ADC. However, this section only describes connecting to an Arduino.
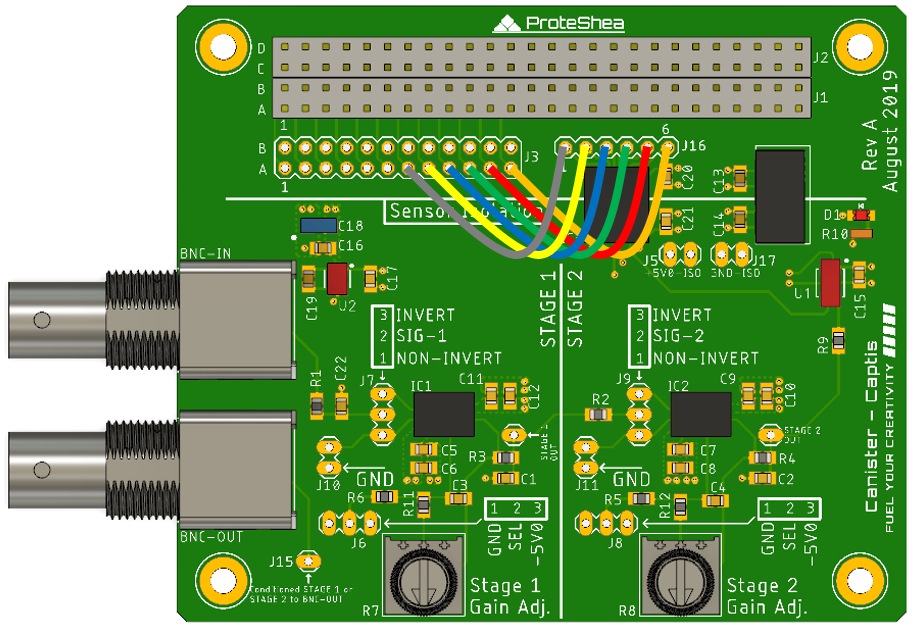
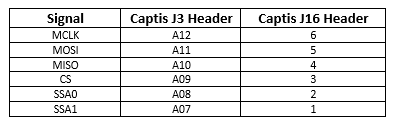
Wire wrapping from J16 to J3 header can be configured differently depending on if the I/O is utilized by other canisters in your stack. Be sure to reference the Captis User Manual if you need help with the pinouts. Since we’re only using Captis with Modulus, we wire wrapped Captis with the configuration shown in Fig. 10. The pin numbering can also be seen in Table 1.
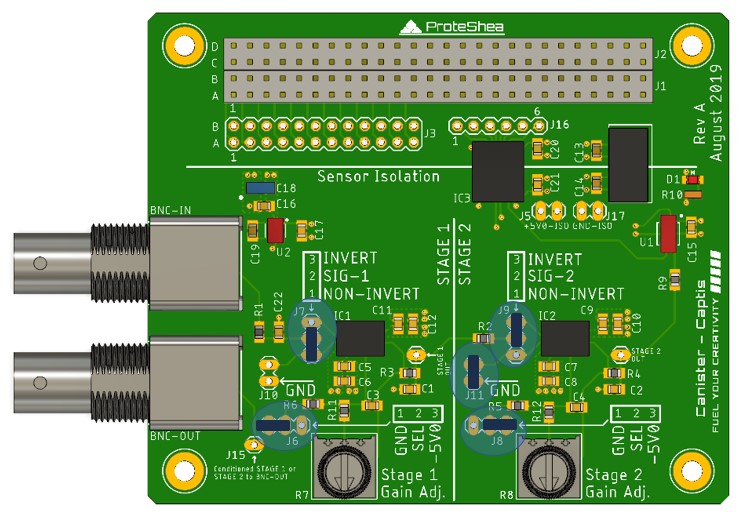
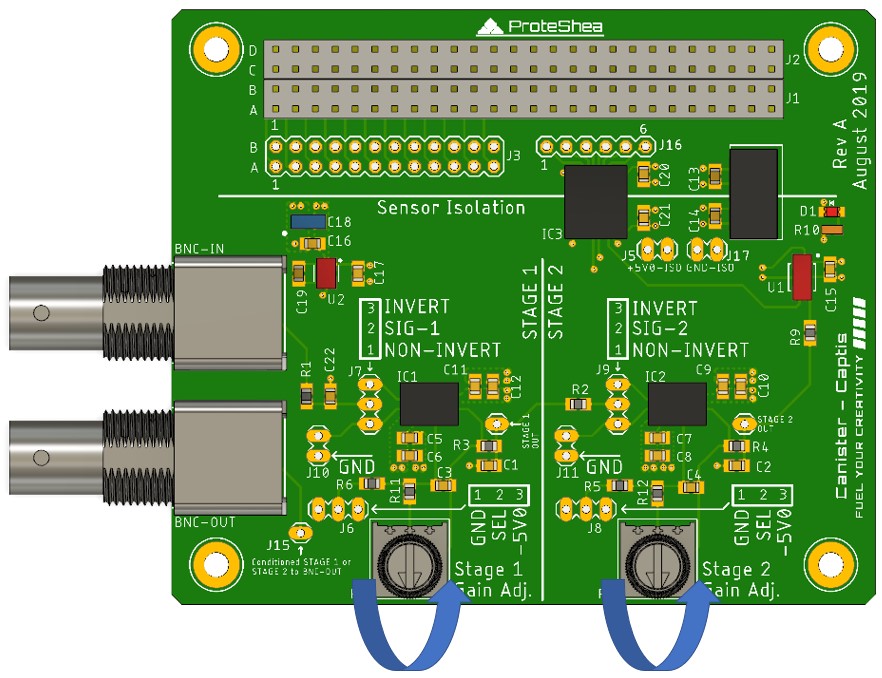
Now that we’ve simulated the circuit, we can go ahead and configure our hardware. Usually, it’s best practice to design, simulate, and then build the circuit. This helps to avoid some of those debugging headaches. For “STAGE 1” located on the left side of Captis, jumper J7 is configured as non-inverting, jumper J15 is connected to GND, and jumper J10 is left unconnected. For “STAGE 2” located on the right side of Captis, jumper J9 is configured as inverting, jumper J8 is connected to -5V0, and jumper J11 is fused to GND. The configuration is shown in Fig. 11 with the jumper locations highlighted in blue.
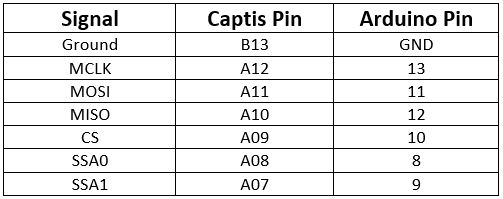
We’re using 12” M/M jumper wires to connect Captis’ 4×26 pin header to the Arduino. The wiring schematic is shown in Fig. 12, and Table 2 lists the pin numbering. Arduino doesn’t support the SPI interface on all of its GPIO pins so be conscious of this if you need to change your wiring.
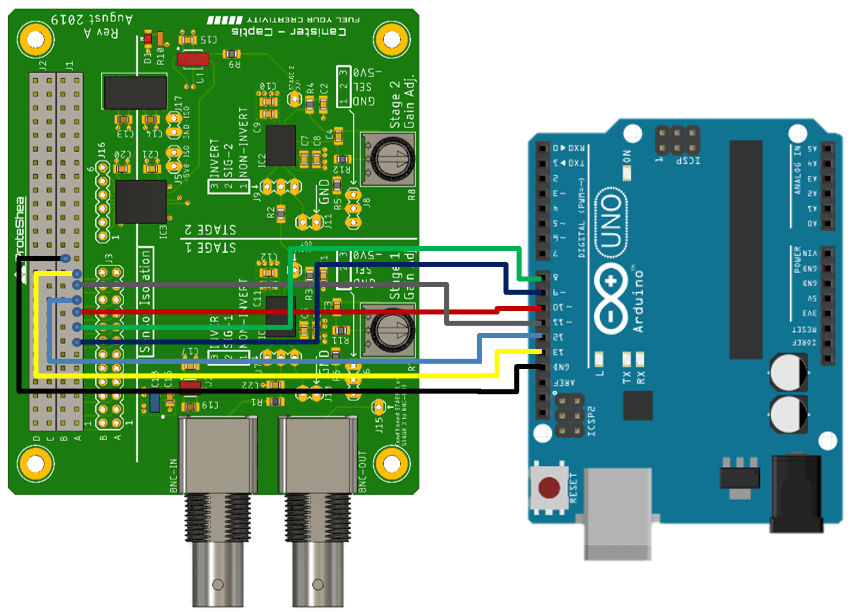
Once you have made all the connections, we can now plug the pH sensor into the BNC connector labeled BNC-IN.
Canister Stack
If you are using Modulus and Captis, carefully mate the two Canisters together. Ensure that the male pins of Captis align with the female header of Modulus. Then, insert your Canister stack into the FuelCan’s 4×26-pin connector, as shown in Fig. 13.
There we go! A portable system for acquiring analog pH measurements with an Arduino Uno.
pH Sensor Calibration
FuelCan Wiring
If you haven’t mounted the Uno onto the prototyping area of the FuelCan, go ahead and do that. If you are using a breadboard instead of Modulus, place the breadboard in the bottom storage compartment to limit the length of the jumper wires. You’ll need to supply +5V and GND to the power and ground rails on the breadboard by using the provided banana jack to test-lead clip cables. You will need two male header pins to mount the test-lead clips on the breadboard side. Plug the Type A side of the USB cable into USB1 receptacle and the Type B side into the Uno’s receptacle to power and program the board. Power up the FuelCan with the AC-DC power adapter.
For additional information about the Fuelcan-910, click here.
Software
We are leveraging code written by DFRobot (found here) to store the received data samples and convert the voltage to a meaningful value (in this case pH!). We will be displaying the data on a 16×2 character LCD, so we must include the LiquidCrystal.h library. The SPI.h library is needed to communicate with the ADC and the math.h library is needed for a few number-rounding functions.
In the void setup() function, we’ll configure the LCD, initialize the SPI, set pins as output, and set unused pins to ground.
In the void loop() function, we’ll check to see if the system time is greater than the sampling interval of 20 milliseconds. If greater, the readADC() function is called so that a data sample can be acquired. Additionally, the code checks if the system time is greater than the print interval. If this is true, the average pH is written to the LCD and the Arduino LED is toggled. Further explanation of writing to the LCD can be found in Project 9.
Acquiring the pH Data in readADC( )
We communicate with Captis via SPI (serial peripheral interface) to read the voltage measurements from the pH sensor. The 8-bit ADC does not require any specific registers to be read from like we saw in Project 19. We simply initiate a SPI transfer which will generate clock pulses on SCLK, and data is received on MISO. According to page 18 of the ADC datasheet found here, we’ll need to initiate two SPI transfers to receive all 16 bits of data, shift, and then concatenate the two bytes received.
Data Buffer Basics
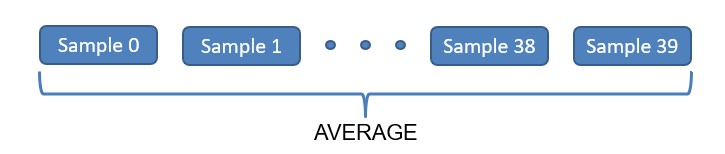
A 40-element array is used to store the ADC samples which helps with the accuracy of the pH measurement and minimizes the effect of data outliers. A sample is stored every 20 milliseconds and the average is computed every 800 milliseconds. A larger data buffer can increase accuracy further, but this will increase computation time, so it becomes a trade-off.
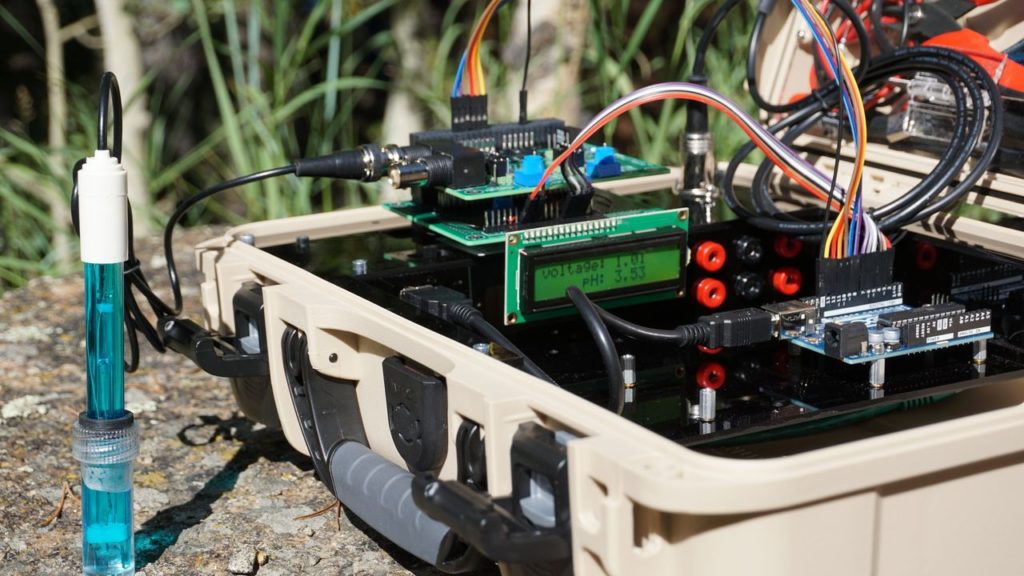
Deploying FuelCan Out in the Field
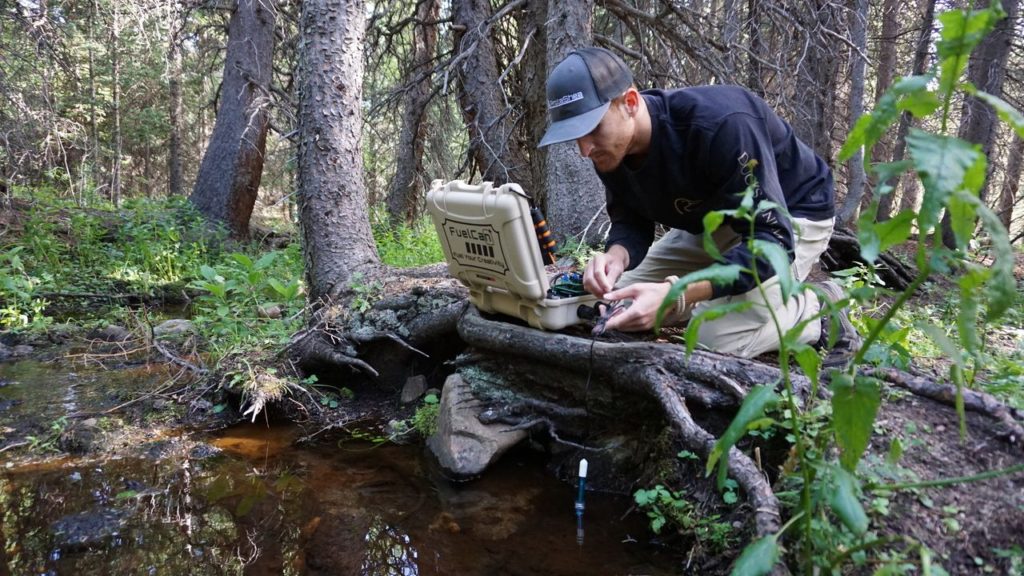
We put our FuelCan and electronics to the test by heading out to the beautiful national forests of Colorado. I decided to make a stop at this small backcountry stream. The FuelCan is great for these types of applications and keeps all your electronics protected when hitting the trail.
Obviously the trees of Colorado don’t contain any outlets for plugging in the AC-DC power adapter, so we paired the FuelCan with a battery solution. We’re able to clip a Jackery battery to the top lid and use the USB to 5-pin DIN connector to easily power up the electronics.
Feel free to post your experimental measurements of nearby lakes or streams in the comments section and good luck with your project!

About Bradley Shea
He is the co-founder of ProteShea, believer in exceptionally crafted maker projects, an electrical engineer, and enthusiast for simplifying rocket science like concepts so that anyone can understand them. He has worked at NASA’s Kennedy Space Center and Ball Aerospace. He received a M.S. in electrical engineering from the University of Pittsburgh and a B.S. in electrical engineering from the University of Florida.